Gun Violence in USA
Gun Violence Prediction by Long Short-Term Memory and Beyond

Gun Violence Prediction by Long Short-Term Memory and Beyond
U.S. has the 28th highest rank of deaths from gun violence in the world, the highest one among wealthy countries and next to Thailand and Phillipine for gun-related death rates. Since January of 2019, a total of 13,973 deaths has been caused by gun violence. Thus, worries of safety and fear of possible occurrence of gun violence become quite a headache for the majority of U.S. residents. Of course, given the statistics above, it is rather understandable and natural for such anxiety. Thus, we want to use data mining algorithms to help people by predicting the possible amount of gun violence in each state in the future. Unfortunately, there has not been a vast amount of studies focusing on prediction and prevention for gun violence. Therefore, any probability for prediction of possible occurrence of gun violence to a person from our model can be rather naitve and even misleading. The major goal for this project is to at least become a motivation for researchers to start utilizing the powerful data methodologies to help diminish the anxiety and fear of possible gun-related incidence and thus benefit the entire society
Therefore, to predict the possible amount of gun-related incident in the future, we decide to apply the Long Short-Term Memory. We train a Long Short-Term Memory model based on records from previous years and such model is able to make prediction.
Gun Violence Death in 2019
Number of Mass Shootings in 2019
Number of Teenagers Killed in 2019
Number of Injuries in 2019
Gun Violence Data
There's currently a lack of large and easily-accessible amounts of detailed data on gun violence. This database aims to change that; it makes a record of more than 260k gun violence incidents, with detailed information about each incident, available in CSV format. We hope that this will make it easier for data scientists and statisticians to study gun violence and predict future trends.
During the initial data cleaning process, we notice the amount of data recorded in 2013 is quite low. Such low volumn may lead to possible training or evaluation error later for our model. Thus, we decided to discard all data in 2013. In addition, despite 29 columns of different data, the most important columns are "State".
We find that each state and each month have some internal tendency by visualization results. Therefore, we collect the killed number sequence by the order of year and then split the data to per state and per month, thus we got 50 states with each has 12 months data, 600 sequences. Each data contains the killed number from 2013-2018 years. We further split the whole dataset into training and testing set to evaluate our method.
Long Short-Term Memory
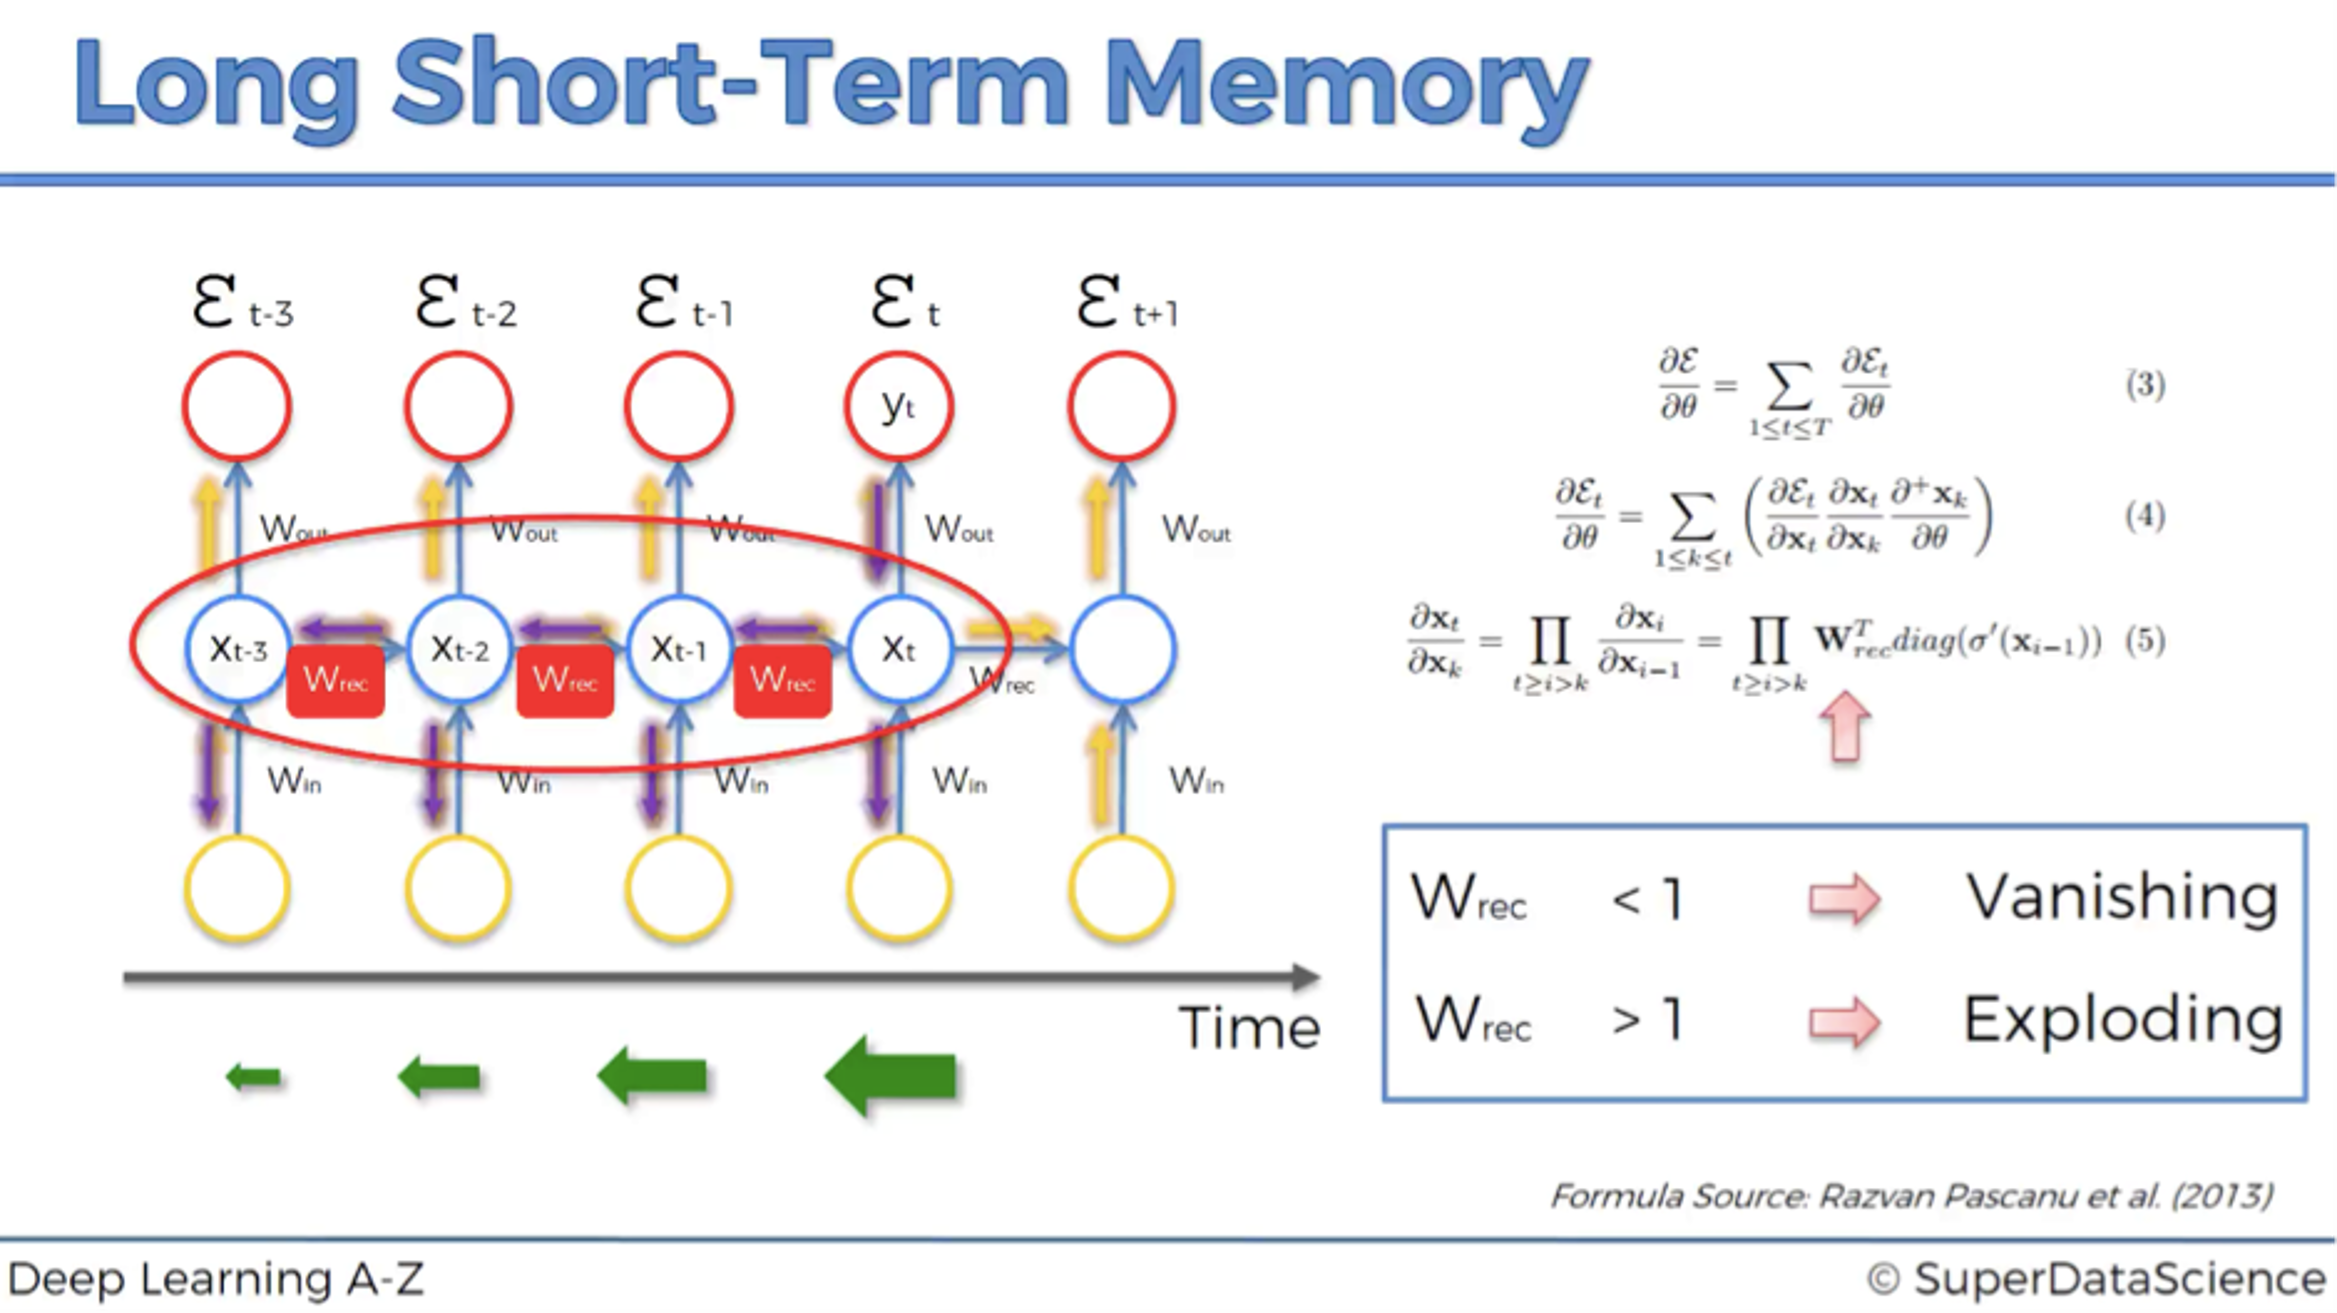
LSTM: Long short-term memory (LSTM) is an artificial recurrent neural network (RNN) architecture used in the field of deep learning. Unlike standard feedforward neural networks, LSTM has feedback connections. It can not only process single data points (such as images), but also entire sequences of data (such as speech or video).
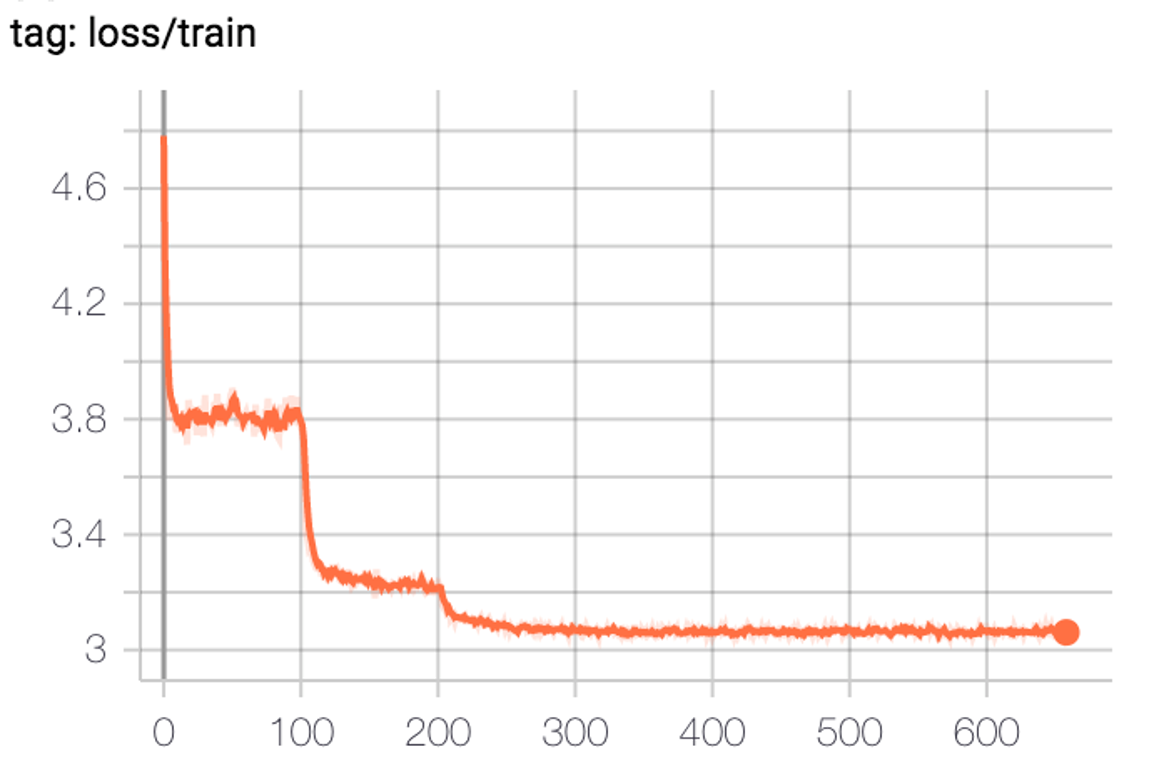
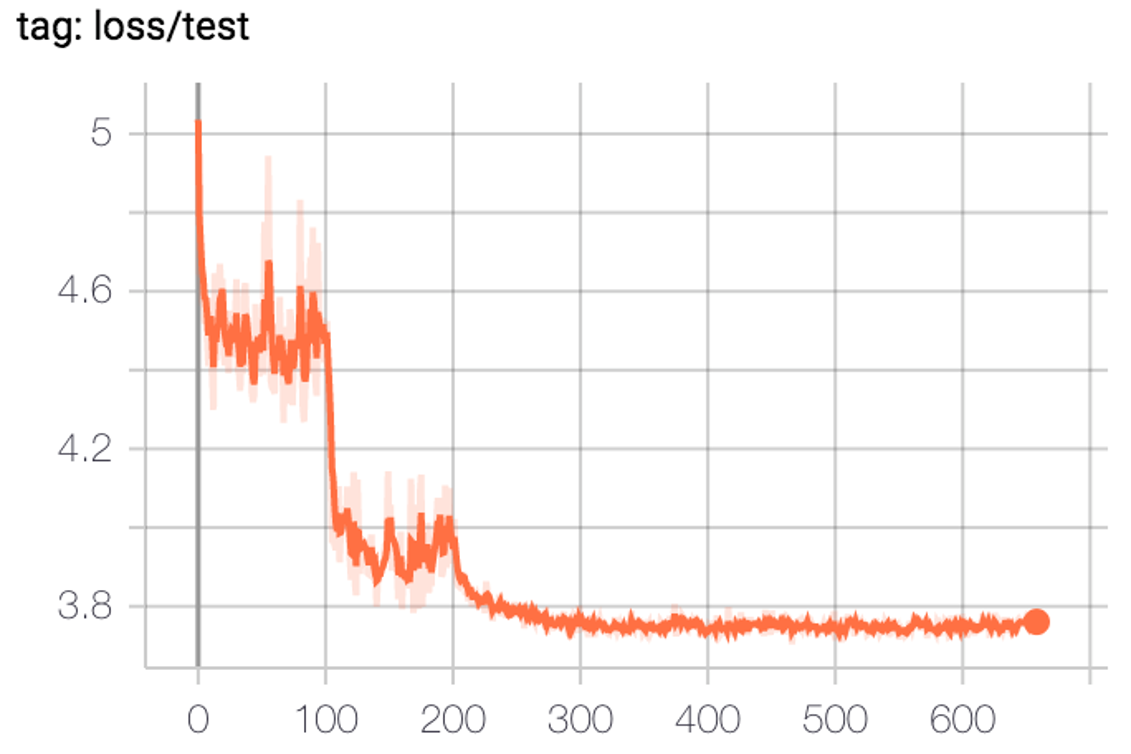
As shown on the loss curve figure, the model successfully learns the variation tendency on training set. And there is an obvious downtrend when applied it on testing set. This demonstrates the effectiveness of our long short-term memory model. Thus, by further applying data in 2018, we can use the model to predict the killed number on each state on 2019.
We use Stochastic Gradient Descent (SGD) as the optimization method, with momenta = 0.9 and weight decay = 5e-03. We use 0.1 learning rate and decay it by 1/10 on 100 and 200 training epochs. Since the dataset is small, we conduct data augmentation by randomly plus or minus 0~3 for each killed number sequence.
 In this project, we analyze the deaths caused by gun from 2013 to 2018. Specifically, we give a detailed discussion on the deaths number on different states and visualize the tendency for each month. We find that more people are killed on summer and less people are killed on February.
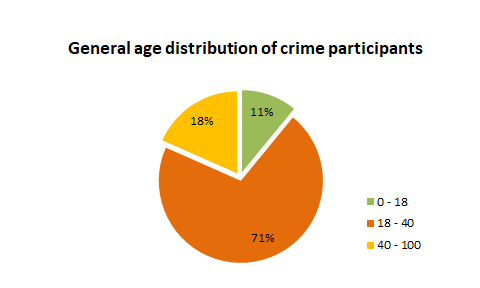
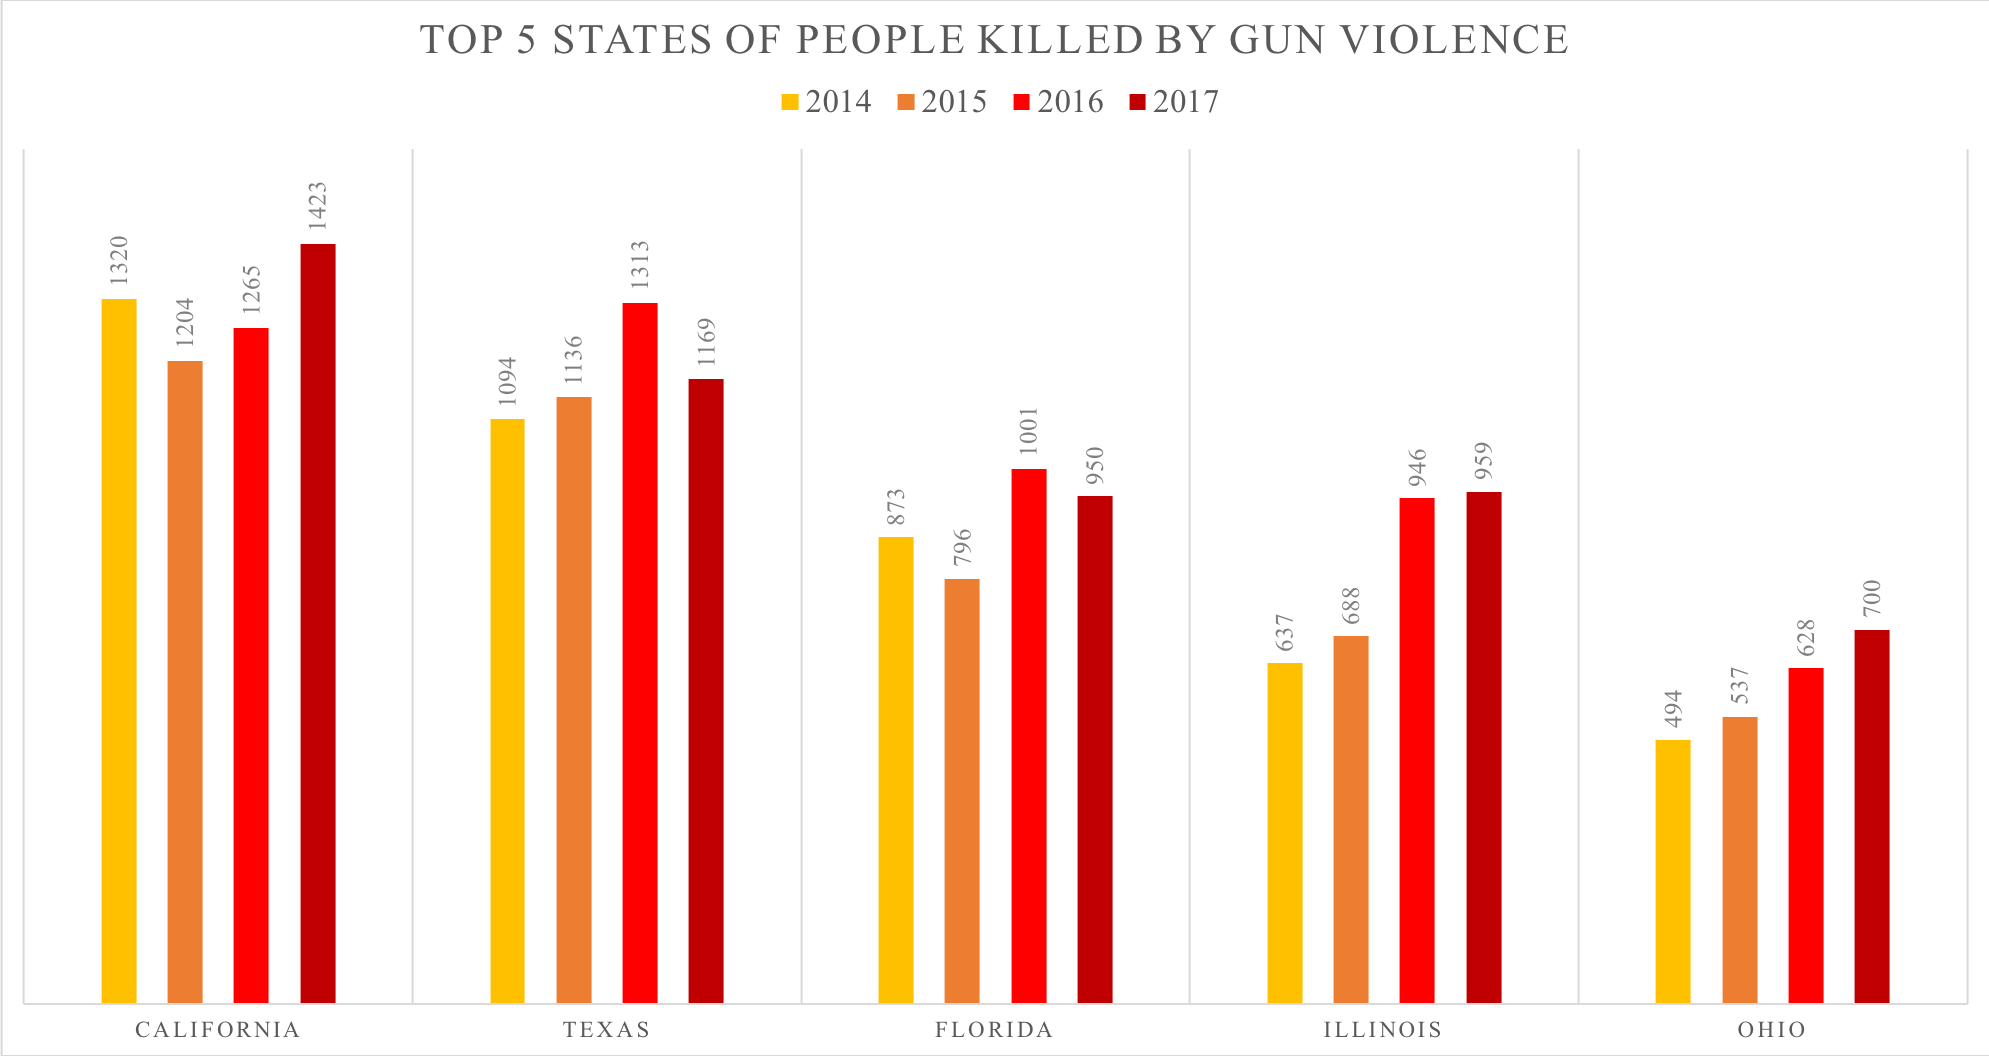
Furthermore, we count the killed number on each state and find that California, Texas, Florida are the Top. 3 state that gun violence occurs. Moreover, we analyze the age distribution and found juvenile criminals are surprisingly accounts for 11%, which should be taken seriously.
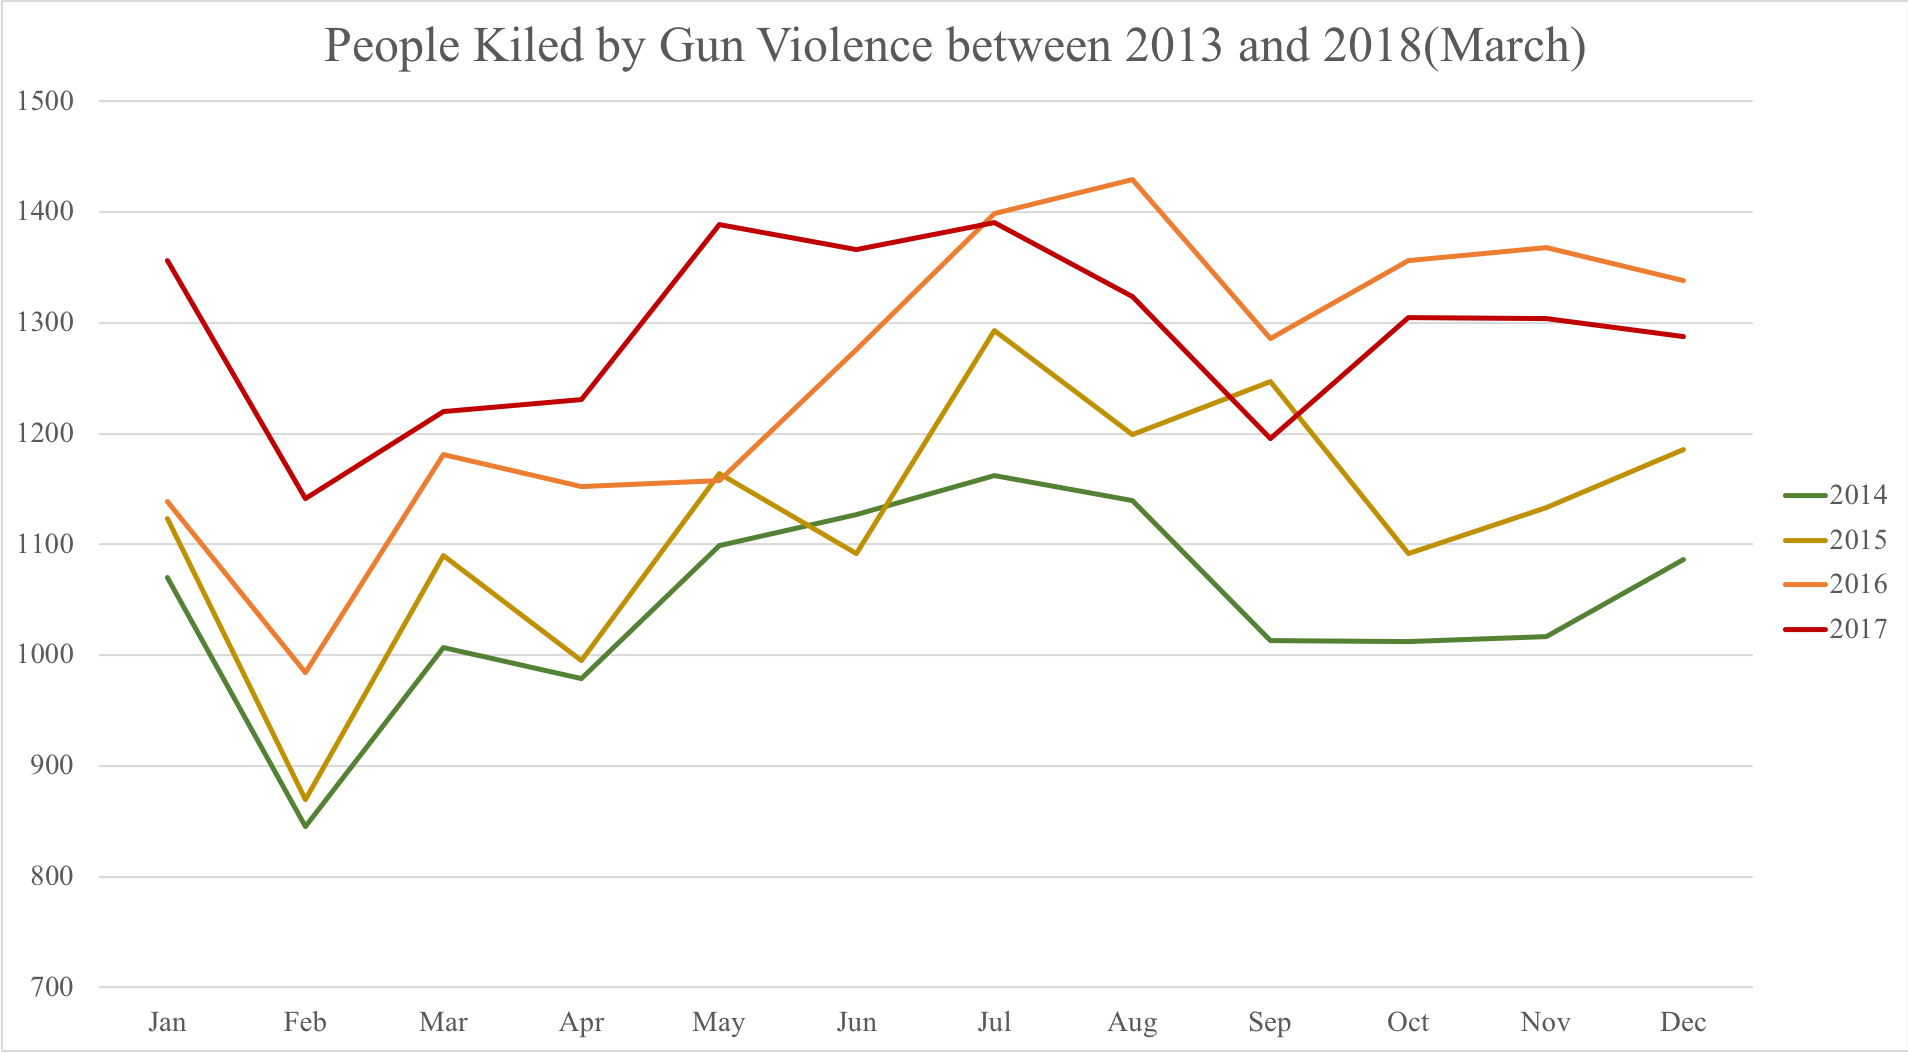
Figure shows the relationship between death counts and months.
Each line represents the trends of people killed by gun violence through certain year.
More people are killed on summer and less people are killed on February.
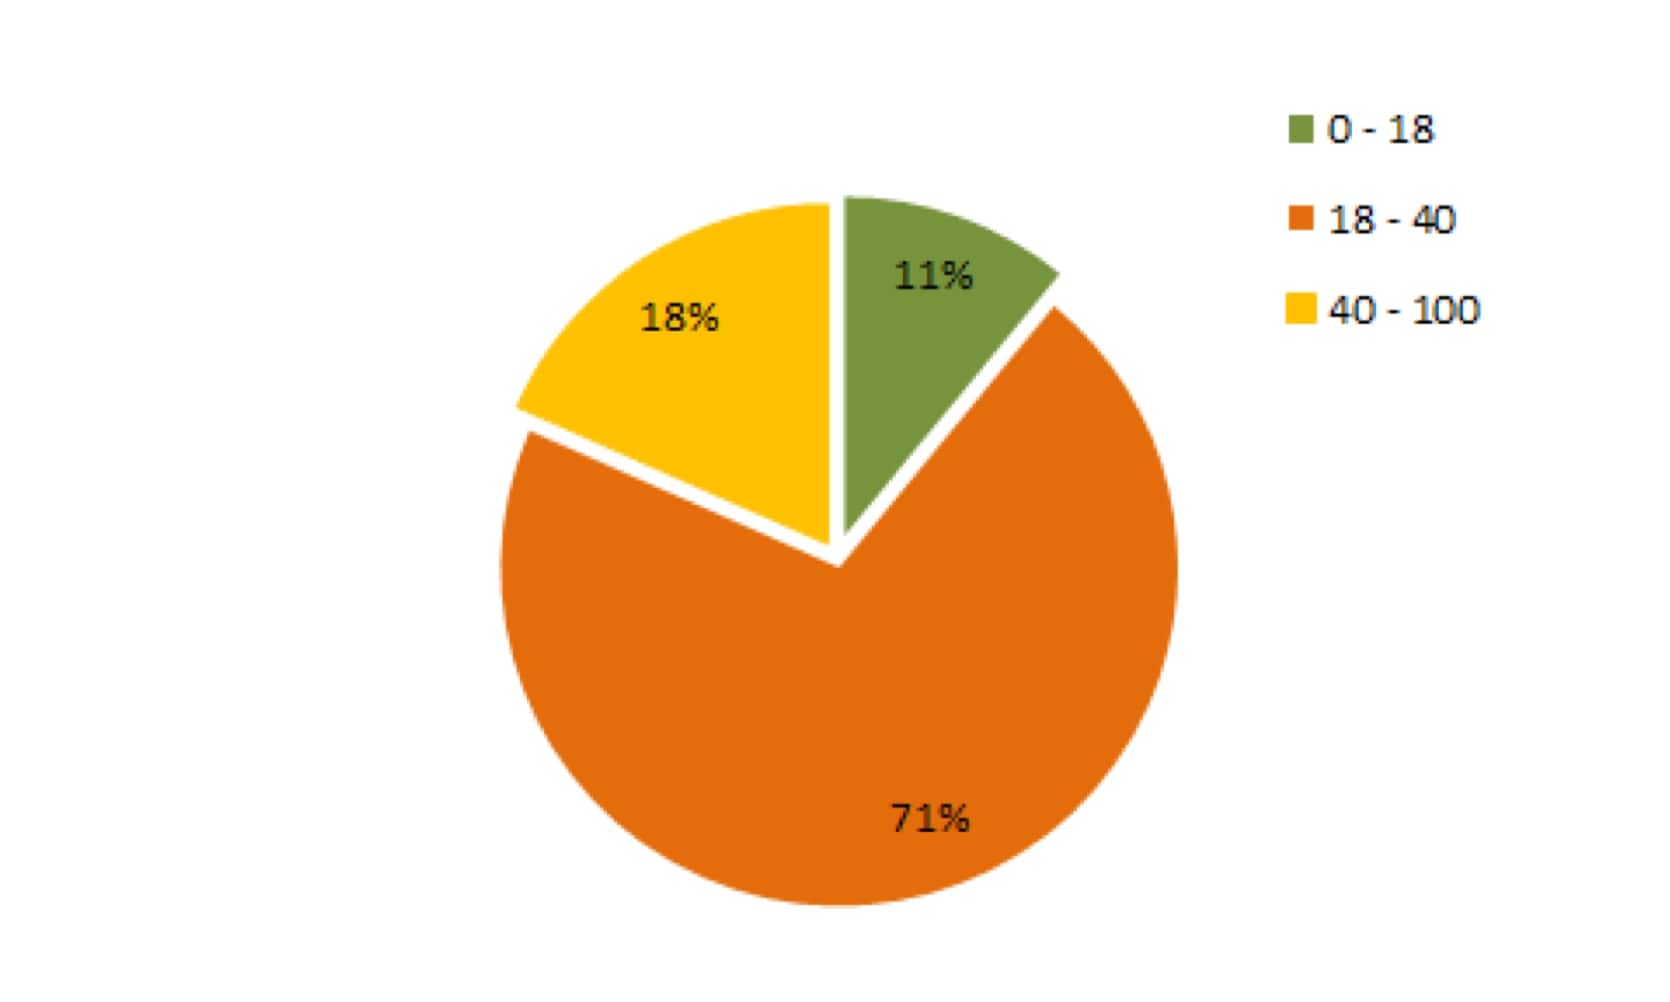
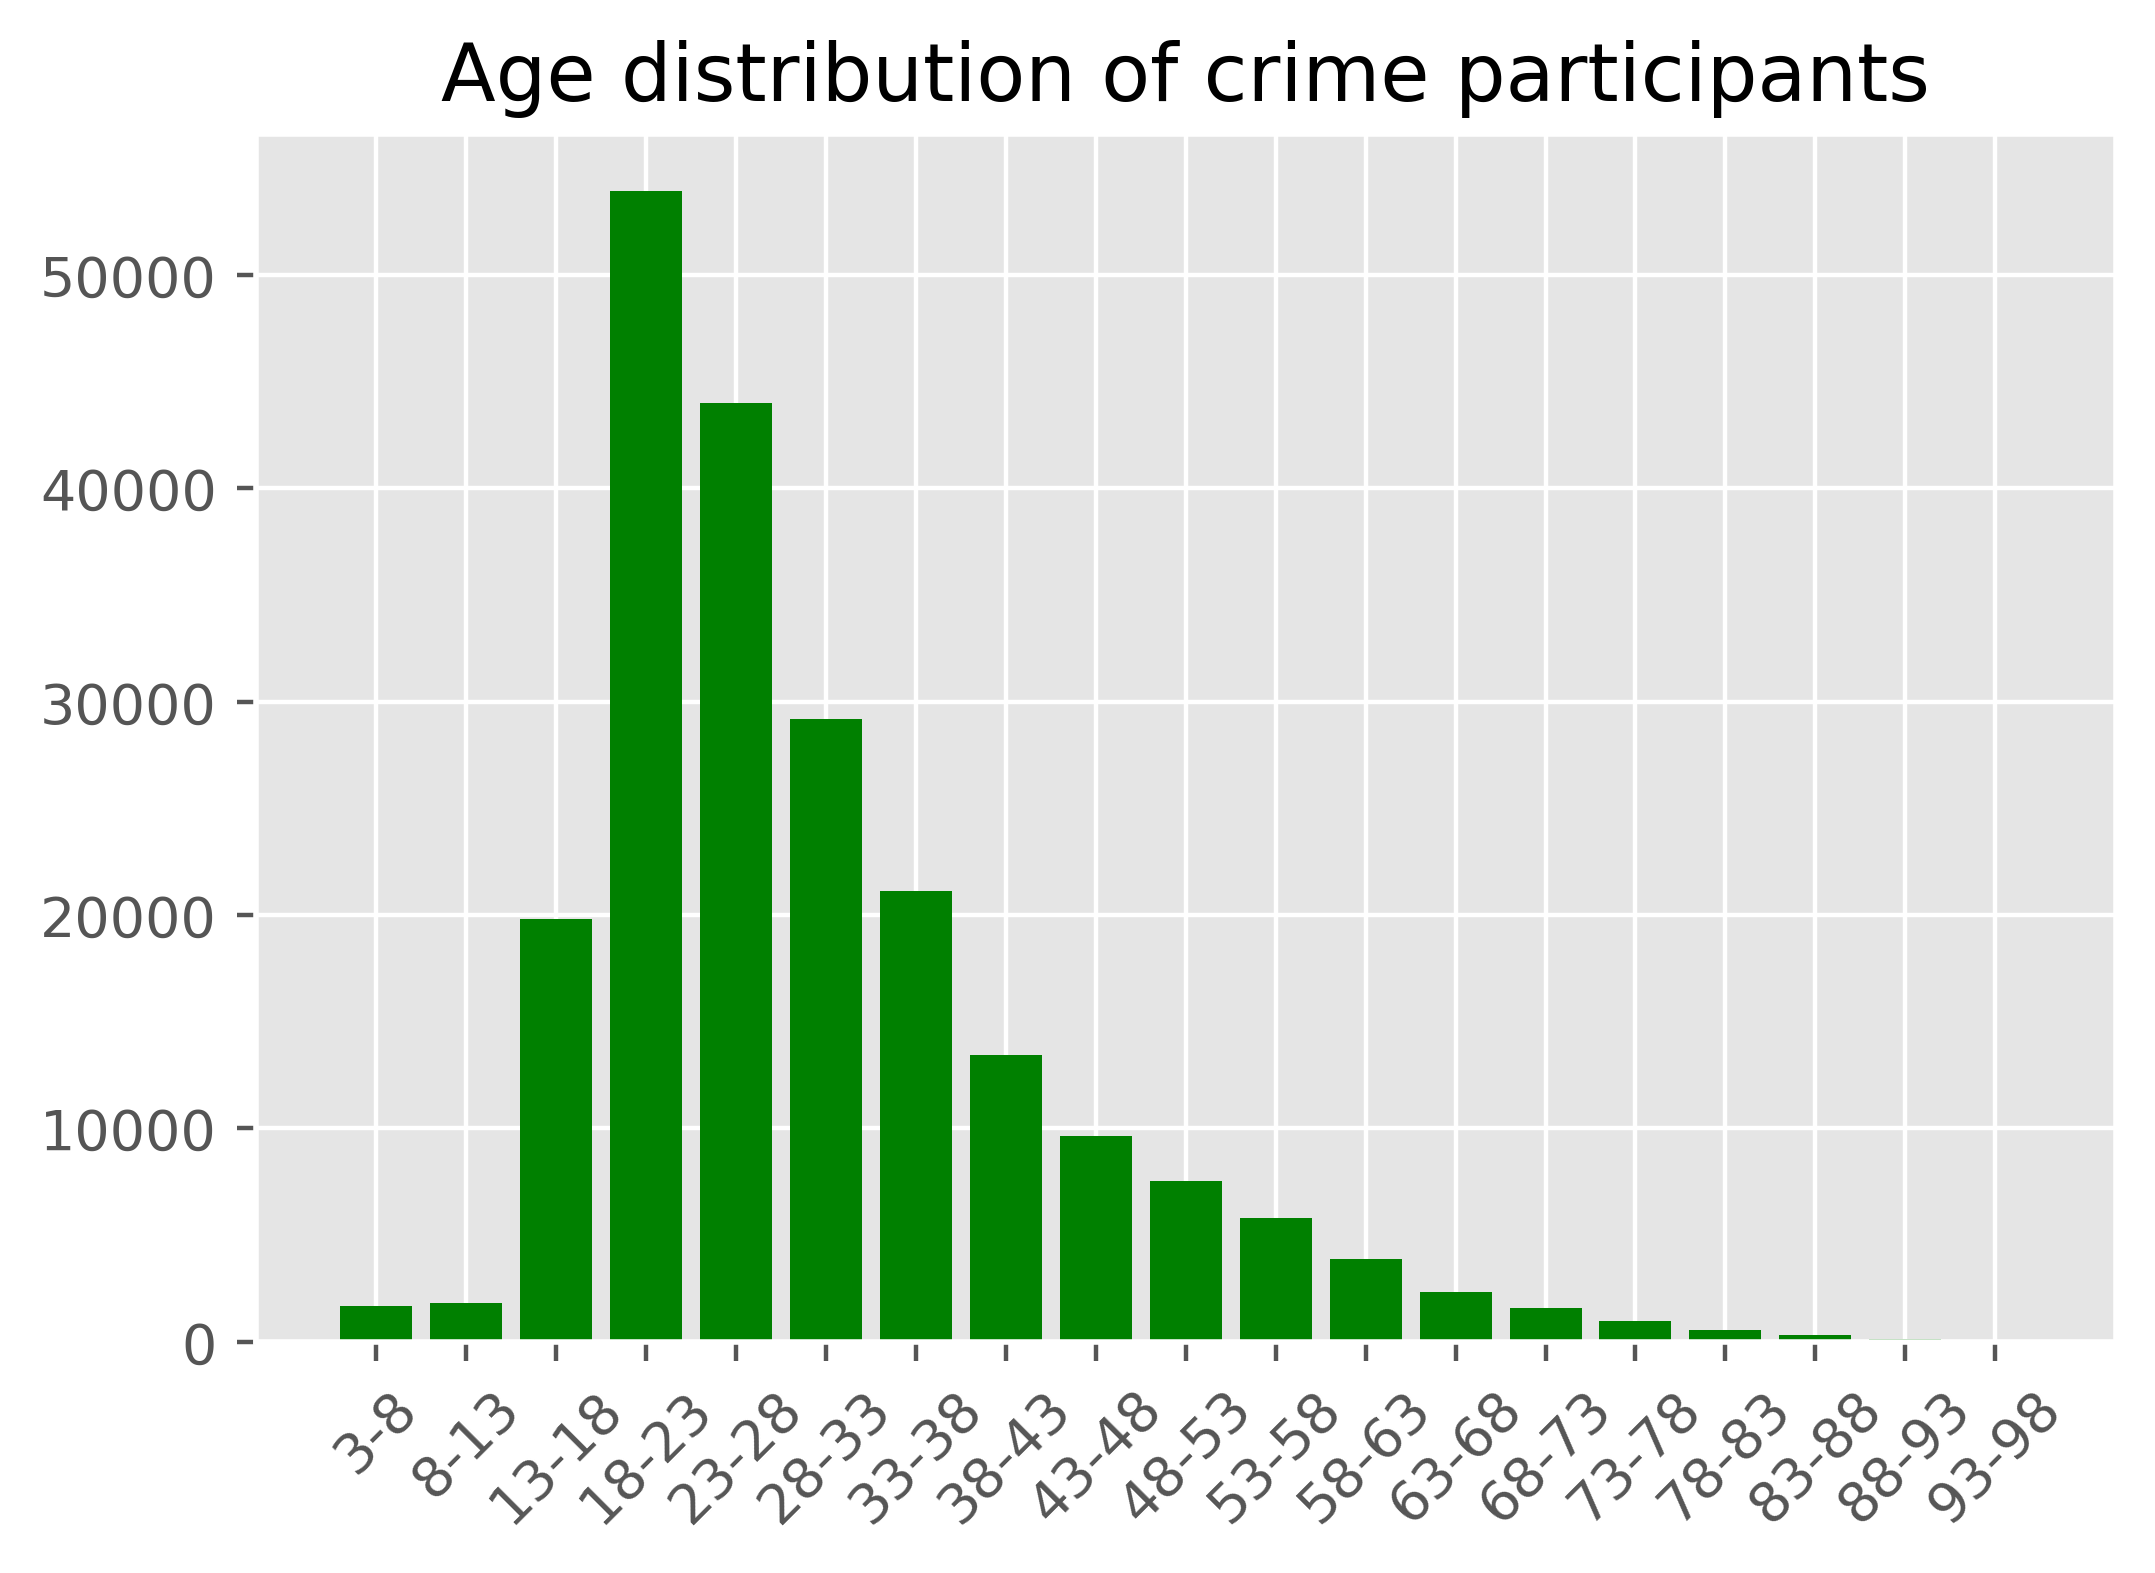
We calculated the number of incidents according to age groups through 2013 - 2018.
The number of participants in gun violence is 23899, 154342, 40132 in age range 0 - 18, 18 - 40, 40 - 100 respectively.
Moreover, as shown in the picture, among all age groups, participants in 18-40 age range commit the most crimes.
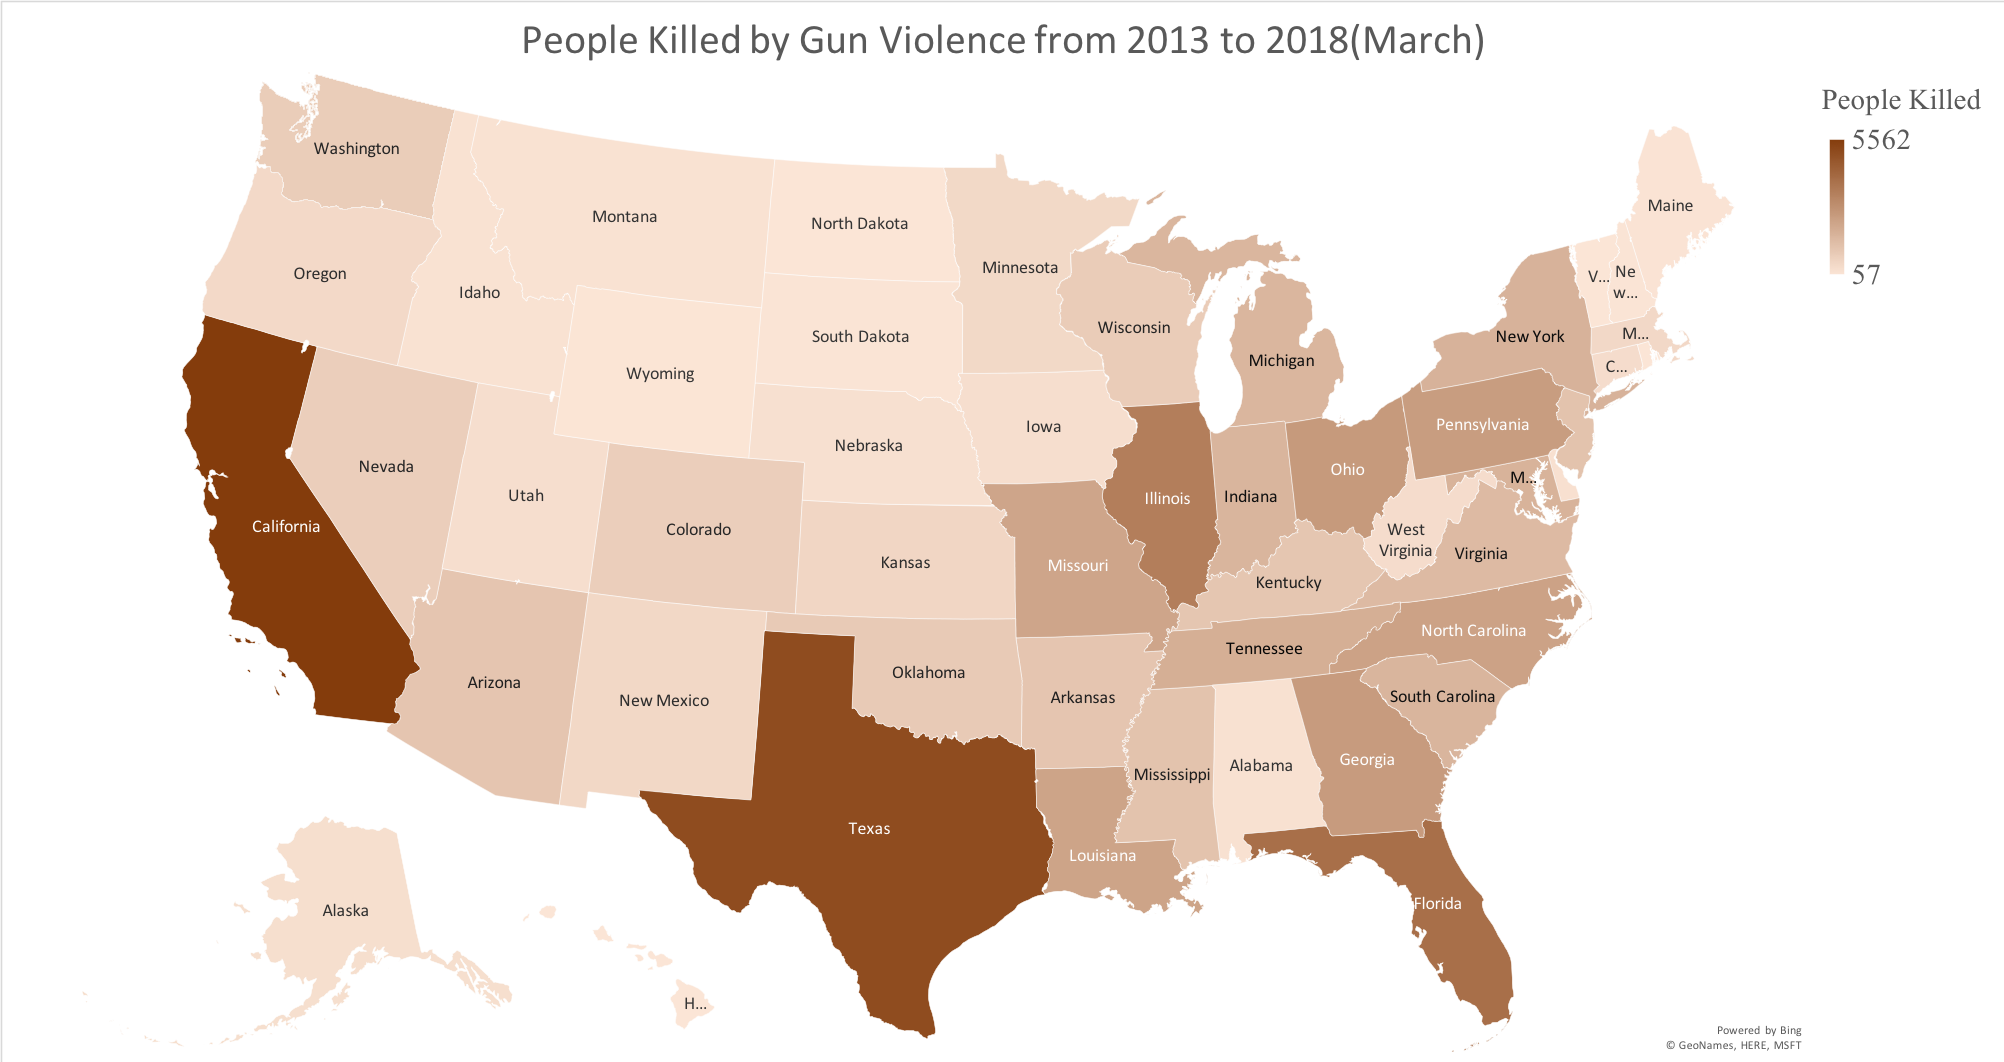
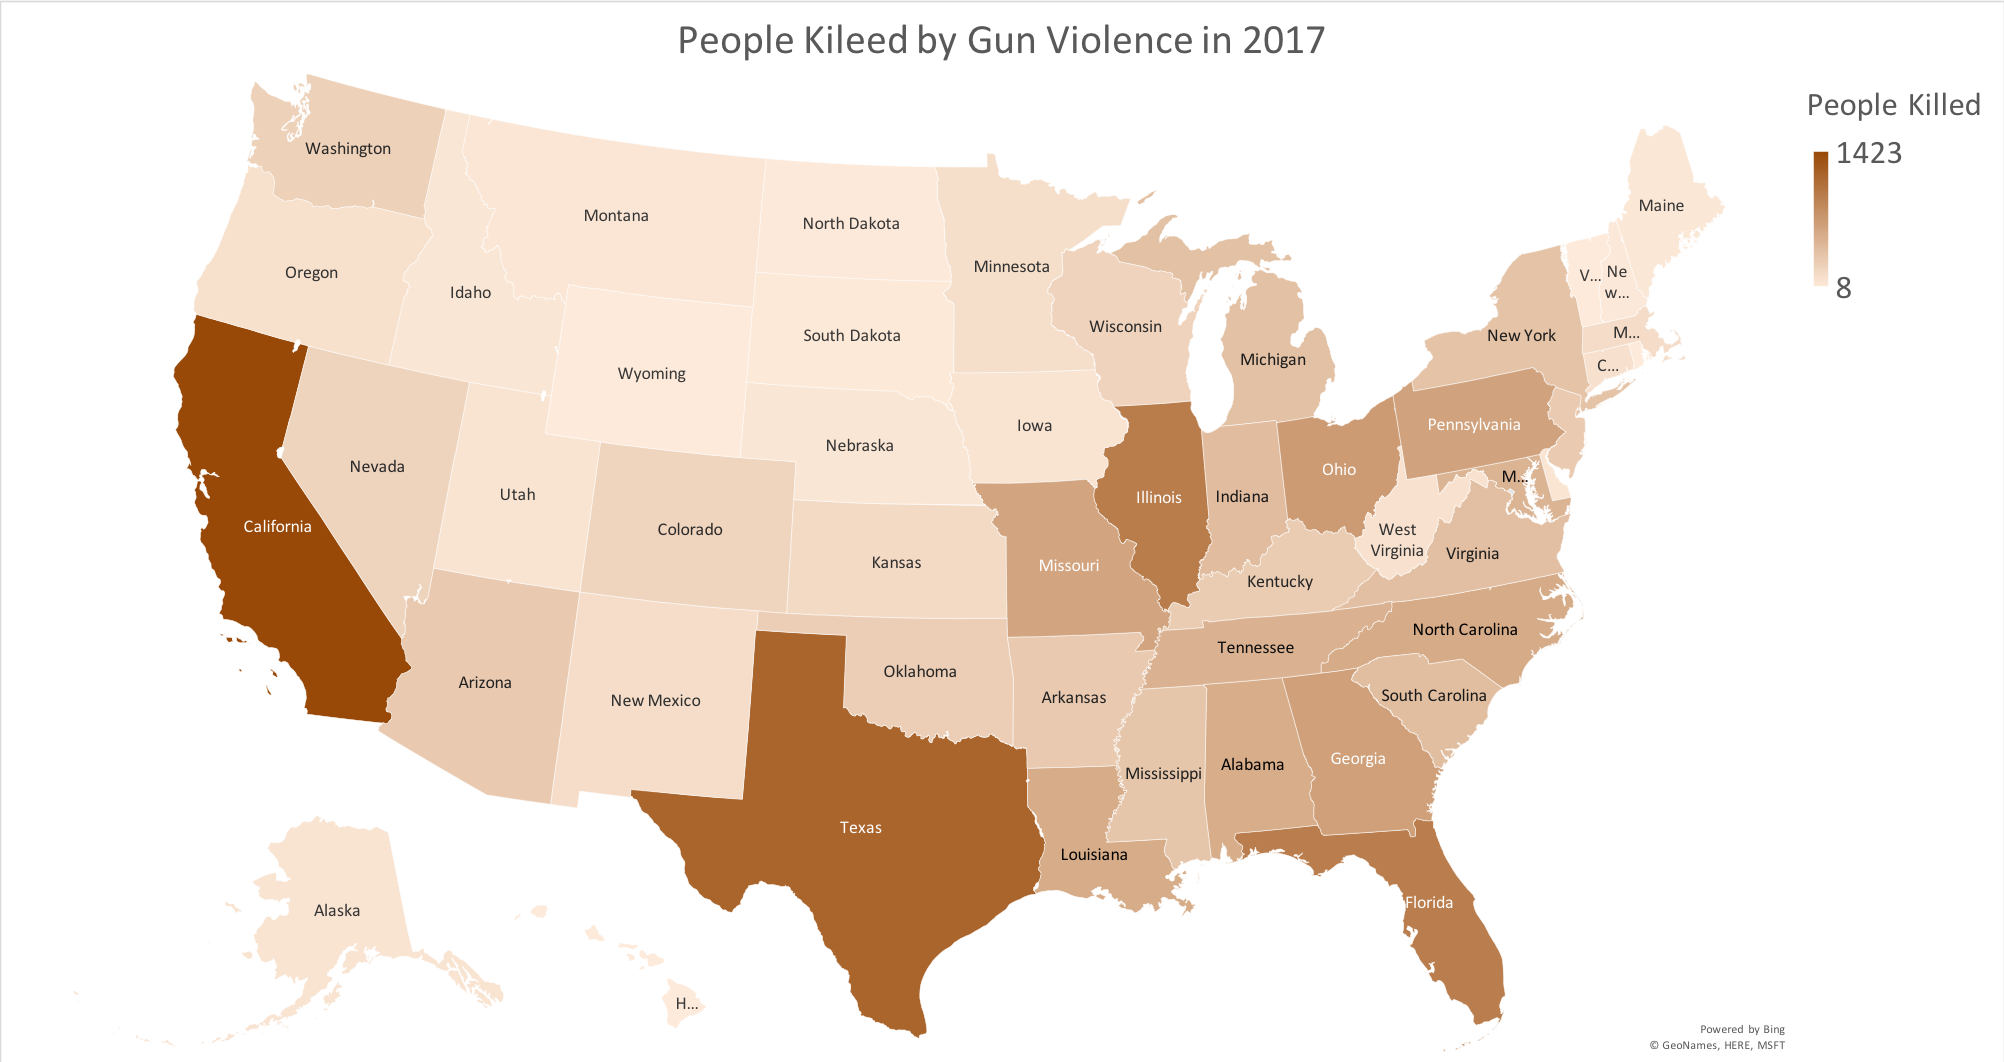
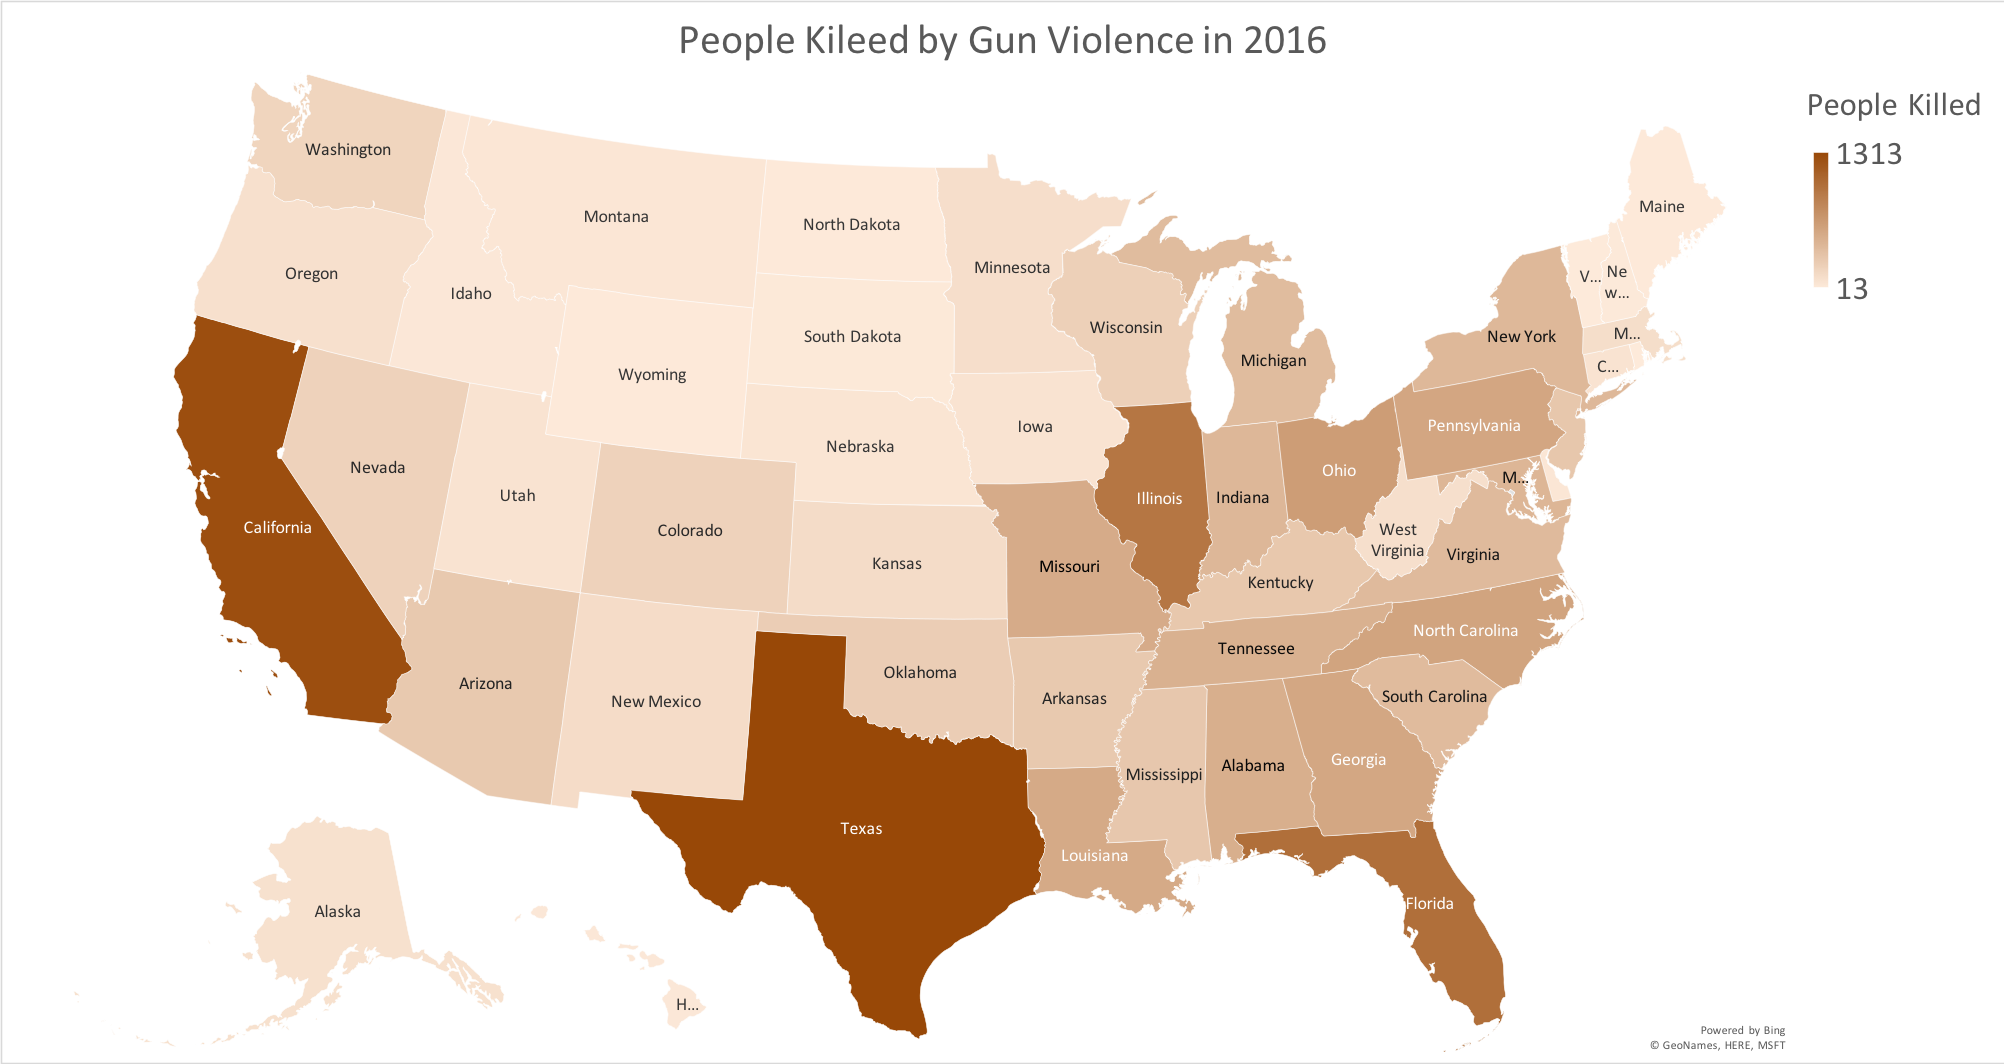
The maps vividly represent the fatal incidents in the total 50 states of the U.S.
According to the pictures, California, Texas, Florida, and Illinois are always among the top 5 states with highest death counts both in total and from 2015 – 2017.
Hence, these four states need special input on gun violence supervision.


This is Photoshop's version of Lorem Ipsum. Proin gravida nibh vel velit auctor aliquet. Aenean sollicitudin, lorem quis bibendum auctor, nisi elit consequat ipsum, nec sagittis sem nibh id elit. Duis sed odio sit amet nibh vulputate cursus a sit amet mauris. Morbi accumsan ipsum velit. Nam nec tellus a odio tincidunt auctor a ornare odio. Sed non mauris vitae erat consequat auctor eu in elit. Class aptent taciti sociosqu ad litora torquent per conubia nostra.